Just How Fast is D.K. Metcalf, Statistically Speaking?
Introduction to Statistical Variable Types

What can NFL Wide Receiver D.K. Metcalf Teach us About the Differences Between Qualitative and Quantitative, Discrete and Continuous Variables
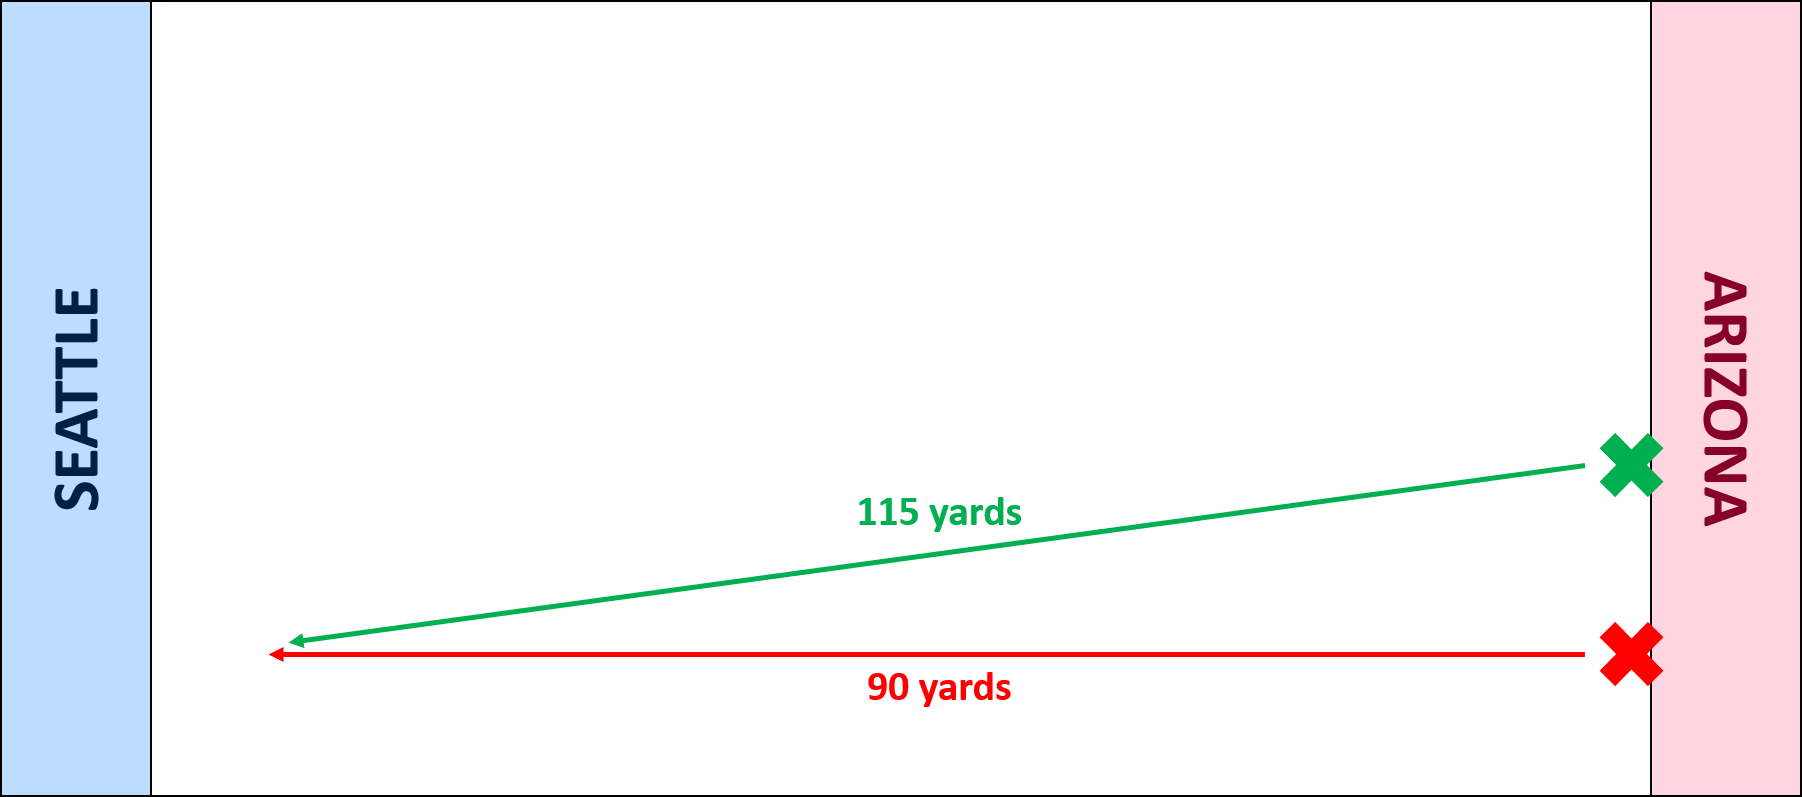
D.K. Metcalf emerged as one of the most exciting young players in the NFL this season. Through 16 weeks he has surpassed 1,200 yards on 80 catches, the only player to do so on less than 130 targets. But his most memorable play of the year wasn’t a touchdown, wasn’t a catch, and wasn’t even on offense! In October the Seattle Seahawks faced the Arizona Cardinals. Arizona’s All Pro safety, Budda Baker, intercepted a Russell Wilson pass and looked likely to return it the entire length of the field for an easy touchdown. But Metcalf had other ideas, sprinting 115 yards, diagonally and dodging blockers, to chase down and tackle Baker and prevent a score. Per the NFL’s Next Gen Stats, Metcalf reached a top speed of 22.64 mph versus 21.27 mph for Baker.
How many players could have chased Baker down before he scored? To answer that question we need to know which other players are as fast or faster than Metcalf. Since “top speed” is not yet a commonly reported metric for NFL players, we must rely on a proxy for speed — the 40 yard dash. Almost all players entering the league through the draft showcase their acceleration by running a 40 yard sprint, so we have that data handy courtesy of Pro-Football-Reference!
We will calculate Metcalf’s time to chase down Baker, effectively a 115 yard dash. Then see how that speed compares versus other players’ 40 yard dash splits. To ensure we solve the problem accurately, we first need to understand qualitative, quantitative, discrete, and continuous variables.
Qualitative Variables - Metcalf is a Wide Receiver, Baker is a Defensive Back
Qualitative (also known as categorical) variables can be thought of as attributes. Common examples are hair color, religion, and gender. For relevance to this “chase down” calculation a useful example is player position. Budda Baker is a defensive back, so it stands to reason only offensive players would need to chase him down. Metcalf plays wide receiver. Other offensive positions include quarterback, running back, tight end, and offensive lineman. You can reduce to more granular categories, such as slot receiver versus outside receiver, offensive tackle versus offensive guard, and halfback versus fullback versus wingback. Whatever specificity is relevant to your use case depends on the analysis you are conducting. These positions are all qualitative variables, also known as categorical variables.
Quantitative Variables - Metcalf and Baker Ran 22.64 and 21.27 mph, Respectively
Quantitative variables are measured in terms of numbers. Height, weight, and shoe size are examples that apply to everyone. At age 22, Metcalf traveled 115 yards and achieved a top speed of 22.64 mph. All three numbers are examples of quantitative variables. 22 is an age, measured in years. 115 is a distance, measured in yards. 22.64 is a speed, measured in miles per hour. It’s worth mentioning that, as measurements, all three can be converted to other units of measurement. For instance, we can think of 115 yards in terms of meters, roughly 105.2.
1 yard = 0.9144 meters
115 yards / 1 yard = X meters / 0.9144 meters
We solve for X by “cross-multiplying,” 115 times 0.9144 is 105.156, ~105 meters
Likewise, we can consider 22.64 mph in terms of 40 yard dash speed. This is the conversion we will apply in our python code, below, to compare Metcalf to other players. Let’s start by (1) converting miles per hour to yards per hour, then (2) yards per second, then (3) number of seconds to chase down. This effectively returns a 115 yard dash time.
1,760 yards in a mile
22.64 miles / 1 hour = X yards / 1 hour = 39,846.4 yards per hour
3,600 seconds in an hour
39,846.4 yards per hour / 3,600 = 11.1 yards per second
115 yards chased down
115 / 11.1 = 10.4 seconds
Based on Metcalf’s top speed of 22.64 mph, we estimate it took about ten-and-a-half seconds for Metcalf to chase down Baker.
Discrete vs Continuous Variables - 1 Interception, 1 Tackle, ~115 Yards Chased
A discrete variable is a variable whose value is obtained by counting. A continuous variable is a variable whose value is obtained by measuring. The difference between discrete and continuous variables may best be understood through scales. We count the members of our family in whole numbers, also known as integers. Two parents and one child is a family of three. These are discrete variables, since they are a specific scale — 1, 2, 3 — not 1.4, 2.73, etc. Continuous variables by contrast are potentially infinite. The number of seconds to back your car out of your driveway could be 4.23 seconds or 4.23197432 seconds both in actuality and in the precision of your ability to measure the time elapsed. Why does any of this matter? When we think about 40 yard dash times we must approach them with humility. Is John Brown’s 4.22 time really that much faster than D.K. Metcalf’s 4.33? Is it exactly 0.11 seconds faster or more like 0.109 faster? To the human eye a tenth-of-a-second is imperceptible. But that tenth-of-a-second stretched over a football field may be the difference in a touchdown saving tackle.
It Helps to Graph It
It is often helpful to diagram a problem before you begin it. To solve this problem, we need to solve for the minimum speed it would take to chase down Baker. We know Metcalf did so by running 22.64 mph, so we intuitively know any speed faster than that would also be able to catch Baker (assuming the exact same same distance traveled).
But how much slower than 22.64 mph could Metcalf have run? And how many players can achieve that top speed? Again we must use a proxy for top speed, so we need to go grab our 40 yard dash data.
Writing Code to Webscrape the Data
Depending on the size, scope, and repeatability of your project, it may make sense to write code to acquire the information for you. Even as a beginner in writing python, you would be shocked how quickly you can automate these tasks. The video below shows how my python code leverages the selenium library to retrieve player data from of Pro-Football-Reference and calculates relative speeds. See the code in my GitHub and the 2011-2020 NFL combine 40 yard dash times.
Code Snippet
Click here to see the full code on GitHub. This snippet is from the primary function in the project, which navigates to the combine website for each year sought, engages the dropdown menu with a hover action performed by selenium’s ActionChains method, and clicks the download button. You will notice the term xpath several times. All web pages include elements and one way to engage with a particular element is to call on its specific xpath. Other methods include selecting by class, id, or location on the page. The best approach depends on the page itself, that’s where your intuition comes in!
# Define xpaths of elements on combine site
share_dropdown_xpath = '//*[@id="all_combine"]/div[1]/div/ul/li[1]/span'
csv_download_xpath = '//*[@id="all_combine"]/div[1]/div/ul/li[1]/div/ul/li[4]/button'
xls_download_xpath = '//*[@id="all_combine"]/div[1]/div/ul/li[1]/div/ul/li[3]/button'

# Function to retrieve xls file from site, log time, store in dict
def combineRetriever(year, download_path, combine_site_base,
                     share_dropdown_xpath, xls_download_xpath,
                     sportsref_download_name):
   # Log start of loop
   loop_start_time = datetime.now()

   # Navigate to year's combine site
   driver.get(combine_site_base + str(year) + '-combine.htm')

   # Define and perform hover method
   time.sleep(2)
   action = ActionChains(driver);
   parent_level_menu =    driver.find_element_by_xpath(share_dropdown_xpath)
   action.move_to_element(parent_level_menu).perform()
   time.sleep(2)
   child_level_menu=driver.find_element_by_xpath(xls_download_xpath)
   child_level_menu.click()
   time.sleep(2)
Top 40 Yard Dash Times, This Decade
Baker’s 4.45 clocked in 2017 is in the 90th percentile of faster times in the last decade, highlighted with the red X clearly on the left side of the distribution. But Metcalf’s 4.33 is in another league altogether, 99th percentile behind only 29 other players.

In Conclusion - Hardly Any Other Players Could have Caught Budda Baker
We have estimated it took D.K. Metcalf about 10.4 seconds to sprint the 115 yards. Baker had only 6 yards remaining until the end zone, so a player even a tiny bit slower than Metcalf may not have prevented the score. All told, there are conservatively only a baker’s dozen or so offensive players, nearly all wide receivers, who could have made the play. Robert Griffin III is the sole quarterback to have run a fast enough 40 to suggest he could pull it off, but that was timed in 2012 and he has likely lost some burst eight years into his NFL career. It’s no surprise the U.S. Olympic sprinting team asked Metcalf if he would like to come try out!
Thank you for reading! For questions on this post or if you have any topics you’d like me to explore, send me an email at datadave@substack.com!
In this series, I follow the table of contents in David M. Lane, PhD’s Introduction to Statistics to learn concepts pivotal in statistical analysis. I explore each by analyzing a topic interesting to me and writing code in python to demonstrate real world application. Follow along the source material here: http://onlinestatbook.com/